
Performance is the Dashboard page for trends over time. It uses the same location, group and timeframe as the Overview. Every role can read it.
Open Performance
- In the sidebar, open Dashboard → Performance. The Views and Customer actions tiles on the Overview open it too.
- Pick the locations in Location or group and the period in Timeframe.
If anything needs attention in these locations, a line at the top says how many items are open and links to the Overview.
Follow the trend in Performance Analytics
-
In Performance Analytics, choose Visibility for views or Actions for customer actions.
-
Move along the chart with the pointer, a finger or the arrow keys to read each day. At 6M and 12M each point is a week.
-
The days with reviews show as small bars under the chart. Select Reviews to hide or show them.
-
Select Show as table to read the same numbers as a table.
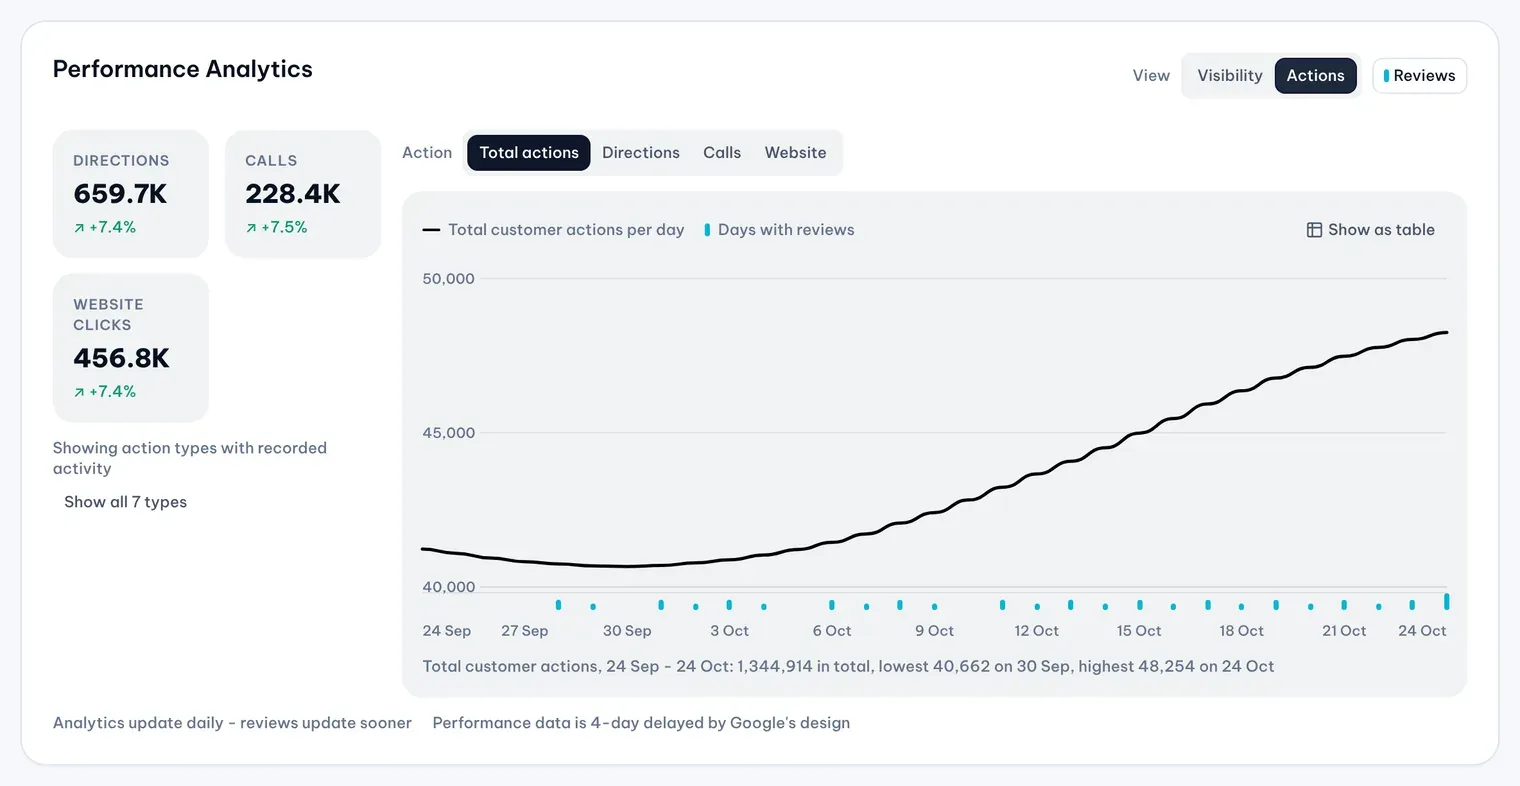
1: Actions. 2: ReviewsIllustrative data
Customer actions has seven types: directions, calls, website clicks, messages, bookings, food orders and food menu clicks.
Compare locations in By location
By location has one row per location, with its change against the previous period:
- views and each customer action type;
- actions per 100 views;
- reviews, average rating and reply rate.
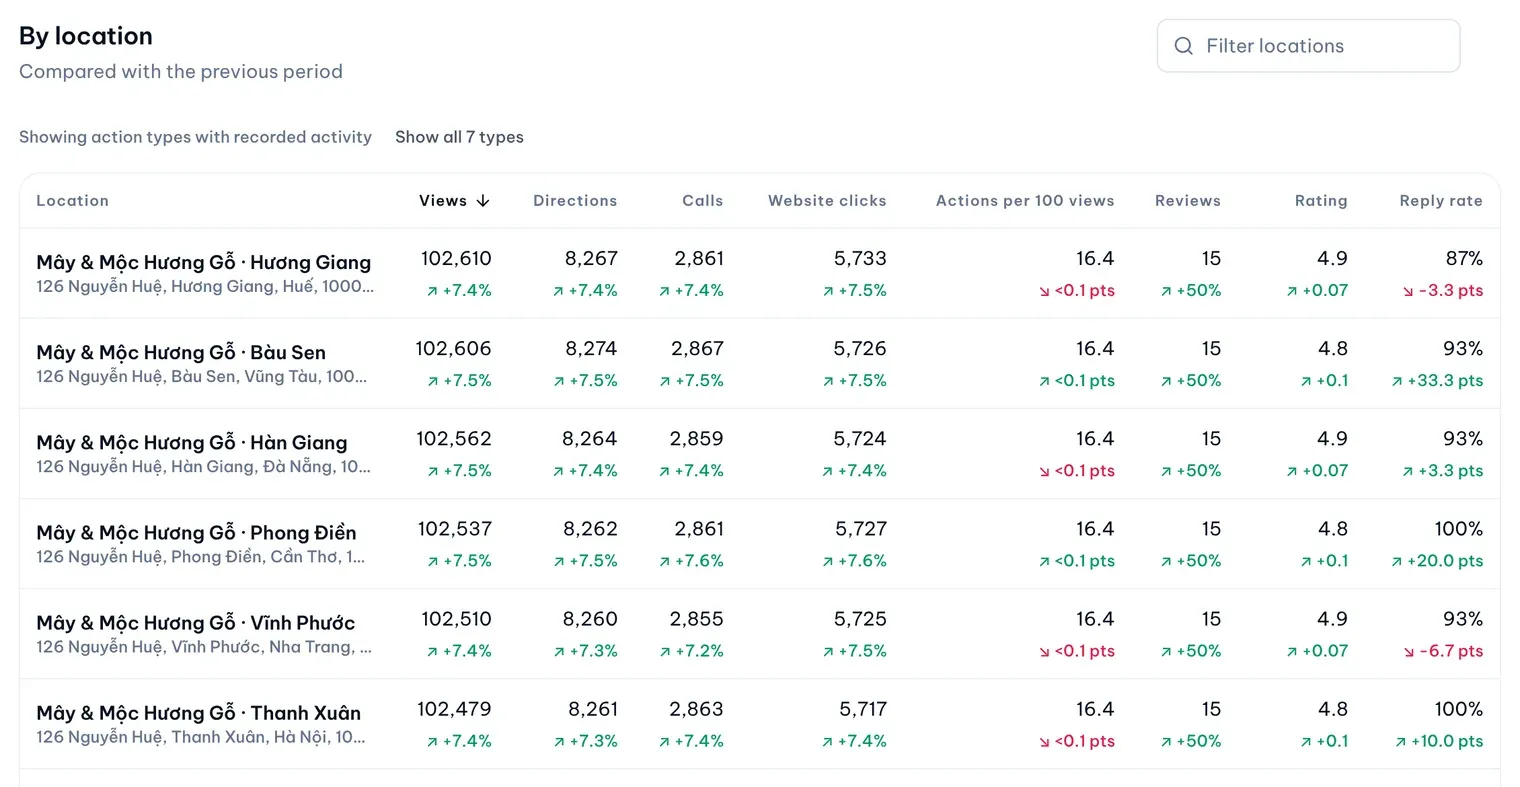
Type in the filter to find a location by name or address, select a column heading to sort and choose 25 or 50 rows per page. Only action types with recorded activity show at first; select Show all 7 types for the rest. A location still importing reads “Importing”, never 0.
Read signals by month and Biggest movers
- Customer signals by month shows search keywords, topics and experience drivers for each complete month, with the change from the month before. A topic count opens the reviews behind it.
- Biggest movers ranks the locations, or the groups, that changed most, up and down. Choose all locations or a group to use it.