
The Dashboard Overview shows how your locations are doing and what needs doing now. Every role can read it.
Open the Overview
-
In the sidebar, open Dashboard → Overview.
-
At the top, pick the locations in Location or group and the period in Timeframe: 7D, 30D, Last month, 90D, 6M or 12M. The longer periods depend on your plan. The Dashboard opens on 30D.
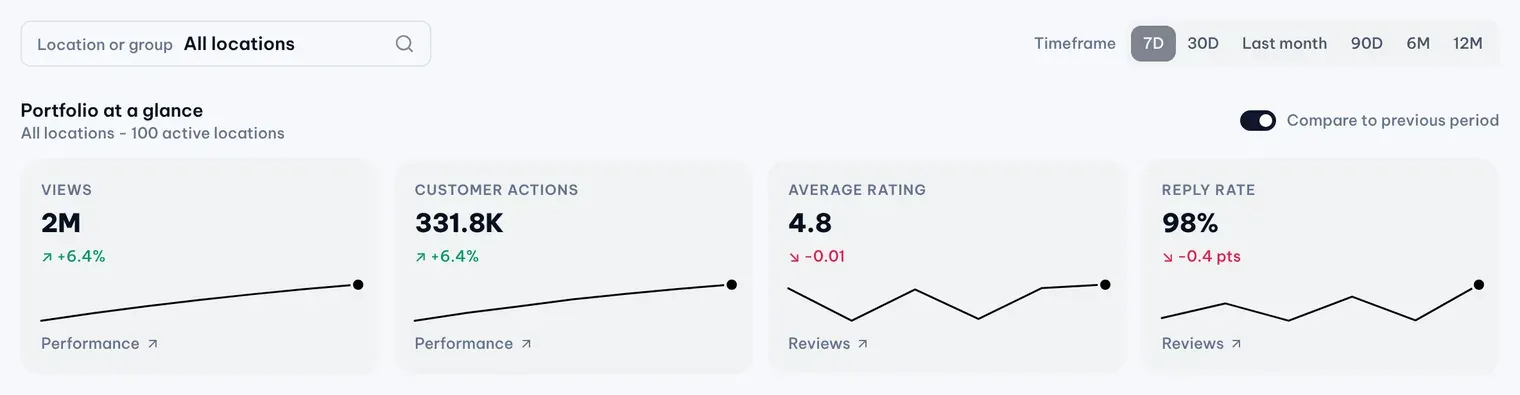
1: 7DIllustrative data -
Compare to previous period above the tiles is on when the Dashboard opens, so each tile shows how its number changed. Turn it off to hide the changes.
The page then shows, from top to bottom, Portfolio at a glance, Needs attention, Spotlight, Health Check and the customer signals.
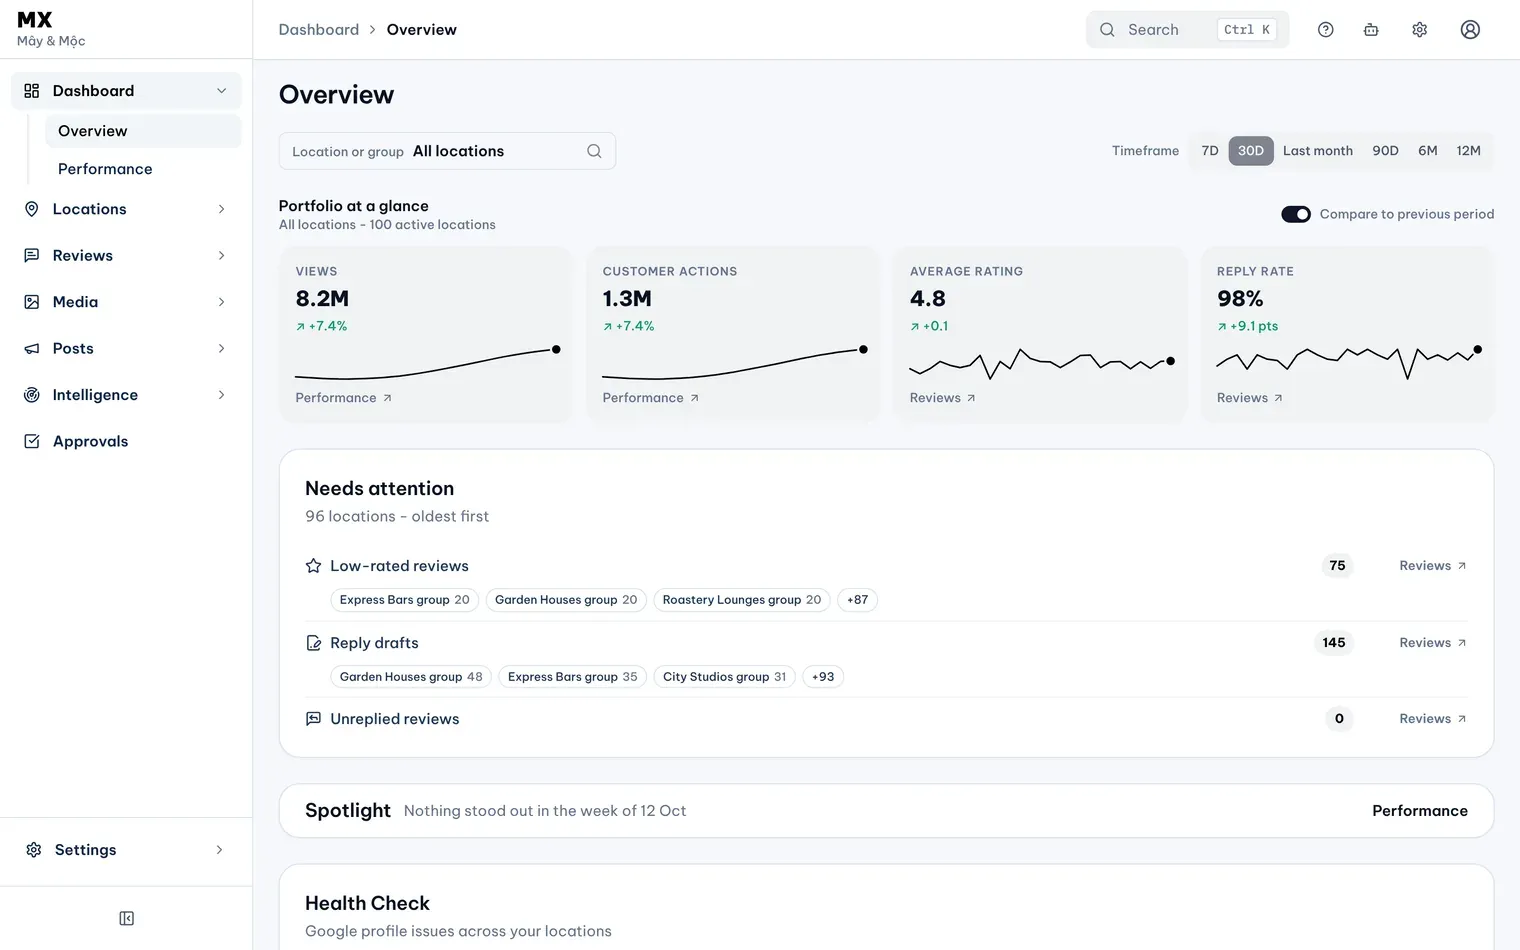
Portfolio at a glance
One row of tiles: Views, Customer actions, Average rating and Reply rate. Owners and Admins also see Feedback rating from Touchpoints.
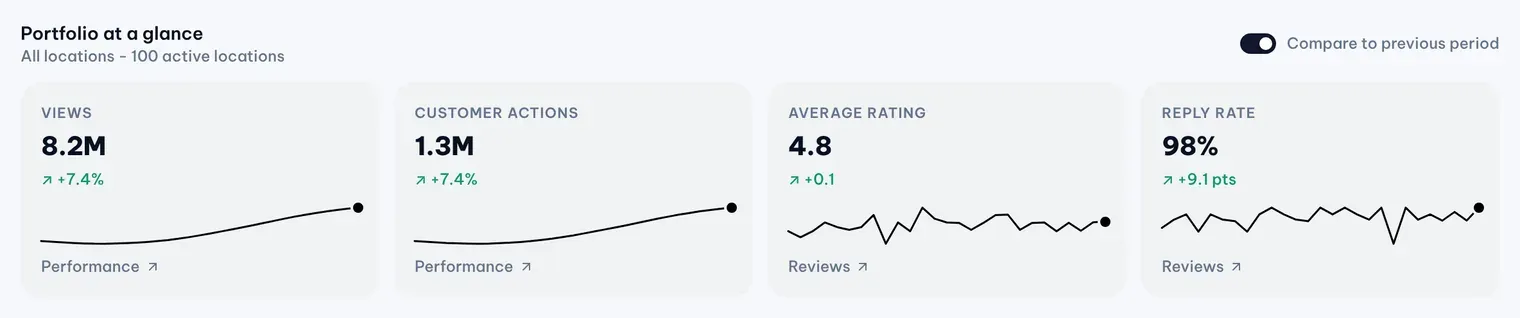
- Each tile shows its total for the timeframe and a small trend line.
- With compare on, each tile shows its change against the previous period of the same length.
- A note under the number says when the data is incomplete, for example while locations are still importing. A number MX can’t read shows N/A with the note “Unavailable”, never 0.
- Select a tile to open the page behind it. Views and Customer actions open the Performance page.
Needs attention
A list of the work waiting in the locations you picked, most urgent first, then oldest. Each row links to where the work is done and, where it can, names the locations and groups behind it.
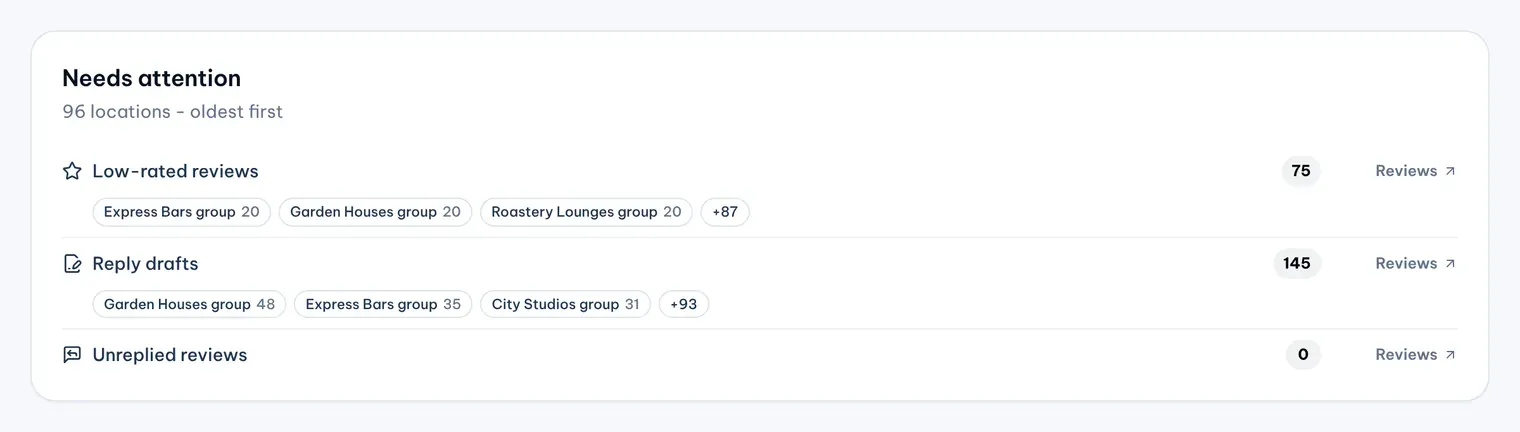
- Unreplied reviews, Low-rated reviews and Reply drafts open the Reviews Inbox with the matching filter.
- Approvals waiting opens Approvals. It shows only to Owners, Admins and Approvers, who can decide.
- Rows such as Failed updates, Reconnect required or Protect alerts appear only when something is open and your role can act on it.
Spotlight
Spotlight highlights locations and groups whose results stood out last week compared with recent weeks, up or down, in views, customer actions per 100 views, reviews received or average rating. Groups appear when you view all locations.
Each row shows what moved, for example “Reviews 18, usually 6”, and opens the Performance page on that week. Spotlight does not follow the timeframe. When nothing stood out, it collapses to one line.
Health Check
Health Check counts how many locations have no profile issues, such as a missing phone number, website, description, hours or cover photo, or a difference between MX and Google. Each issue lists its locations and links to the fix.
Customer signals
The last row shows What customers say, Experience drivers, Top search keywords and Top action for the timeframe. By month on a card opens the same signals month by month on the Performance page.