The Touchpoints Overview adds up what customers did on your feedback pages: how often they scanned a QR code, how they rated, and what they chose next. Only Owners and Admins can open it.
Set the scope
-
Open Touchpoints → Overview.
-
Pick a location or a location group in Location or group, or leave All locations.
-
Pick a timeframe: 7D, 30D, Last month or 90D, plus 6M on Pro and Business and 12M on Business. The page starts on 30 days. Days follow your company’s time zone.

Illustrative data
Every card on the page follows that scope.
Read the headline numbers
| Card | What it counts |
|---|---|
| QR scans | Times a QR code opened the feedback page |
| Rating responses | Visits that left a star rating. A customer who changes their rating counts once, with the last rating they chose |
| Average rating | The average of those ratings, out of 5 |
| Review link clicks | Times a customer chose the Google review button. A click shows intent; it does not prove a review was posted |
| Private feedback | Feedback sent through the form, with the share of it marked resolved in the Feedback Inbox |
| Feedback conversion | Private feedback as a share of rating responses |
When a figure can’t be worked out yet, such as an average with no ratings, the card shows a dash instead of 0.
Read the cards below
-
Daily trend: scans, rating responses, review link clicks and private feedback for each day of the timeframe.
-
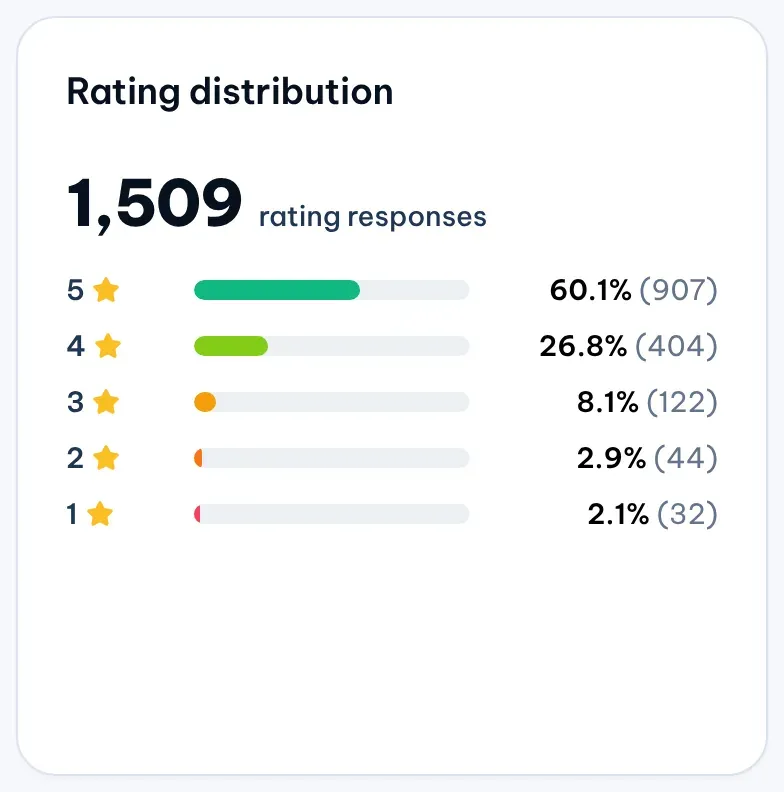
Rating distribution: how many rating responses gave each star rating, and their share.
Illustrative data -
Customer actions: the path from QR scans to rating responses, then what customers did after rating (review link clicks, contact action clicks and private feedback submissions), each with its share of QR scans.
-
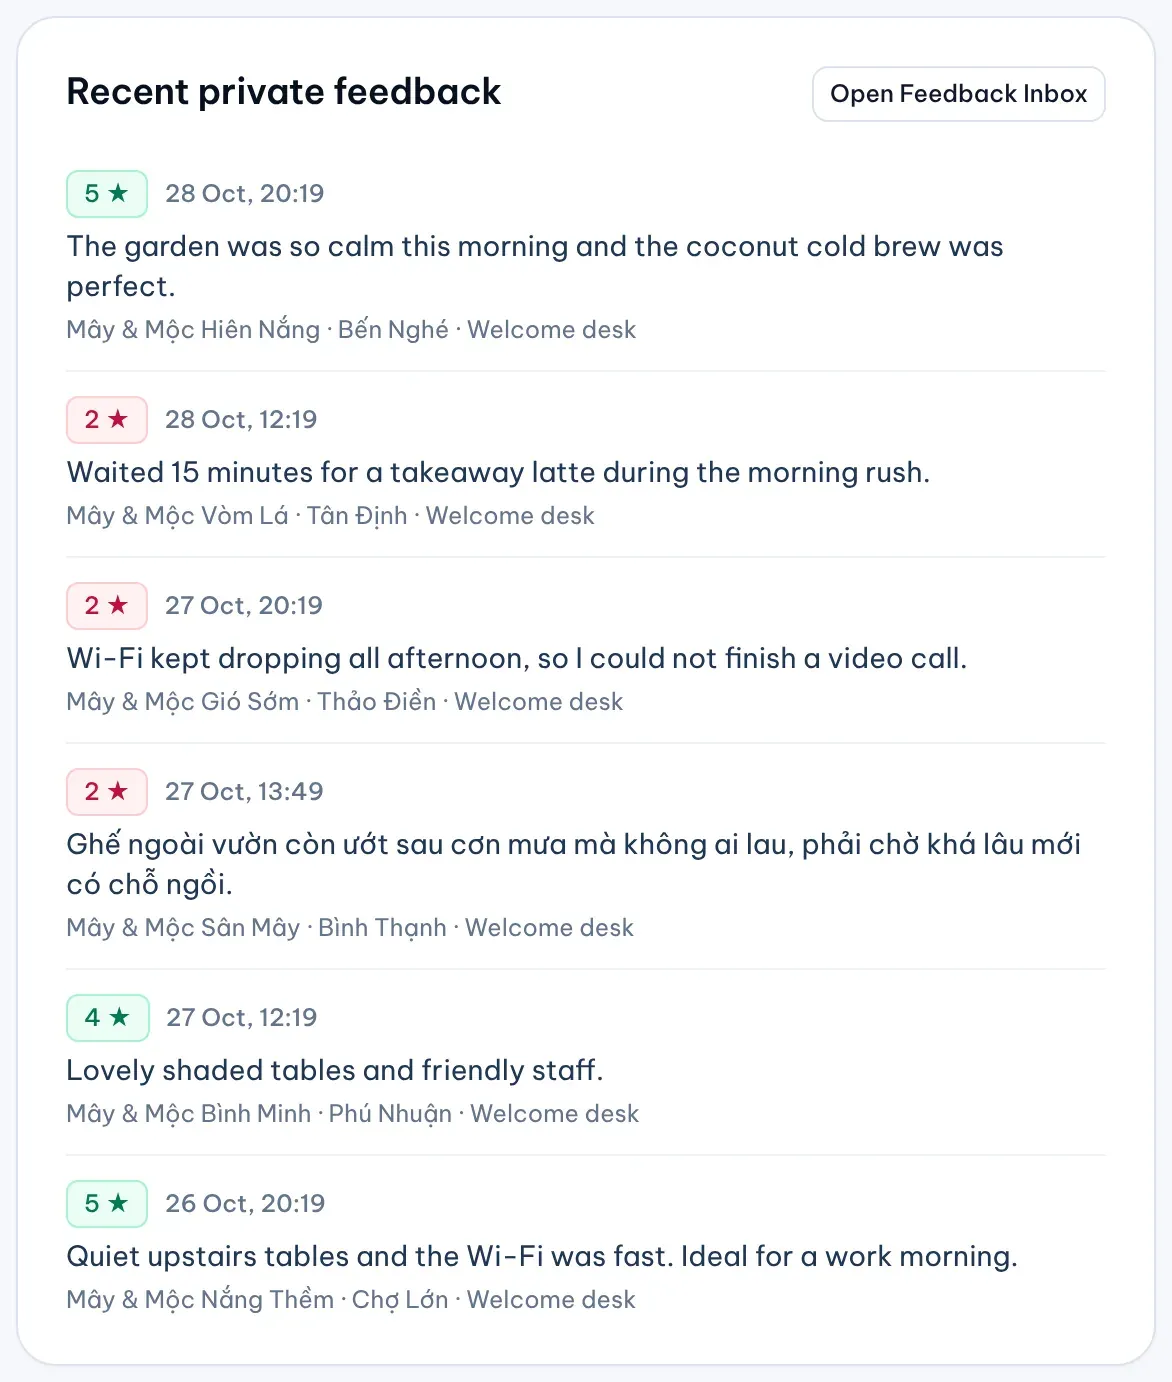
Recent private feedback: the latest feedback with its rating, date, comment, location and QR code. Select Open Feedback Inbox to read it in full, with the same scope.
1: Open Feedback InboxIllustrative data -
Location highlights: the locations with the most scans, the most review link clicks, the most private feedback, and the highest and lowest average rating.
Activity from while a QR code was on still counts after you turn it off or archive it.
Owners and Admins also see a Feedback rating on the Dashboard: the average rating for the timeframe, with the private feedback count and the share marked resolved in its note.